Forecasting
In this notebook, we shall use the modelling techniques we learned about in the concepts notebook and apply that information to forecast or predict future values of a time series.
Content
Load Data
ARIMA manual
SARIMAX
Auto ARIMA
Auto ARIMA with seasonality
Prophet
Seasonality Decomposition and trend prediction
# Import dependencies

import pandas as pd
from statsmodels.tsa.seasonal import seasonal_decompose
from statsmodels.tsa.arima_model import ARIMA
from statsmodels.tsa.statespace.sarimax import SARIMAX
from pmdarima import auto_arima
import matplotlib.pyplot as plt
import seaborn as sns
import warnings
from fbprophet import Prophet
from sklearn.metrics import mean_absolute_error

warnings.filterwarnings("ignore")
Load data
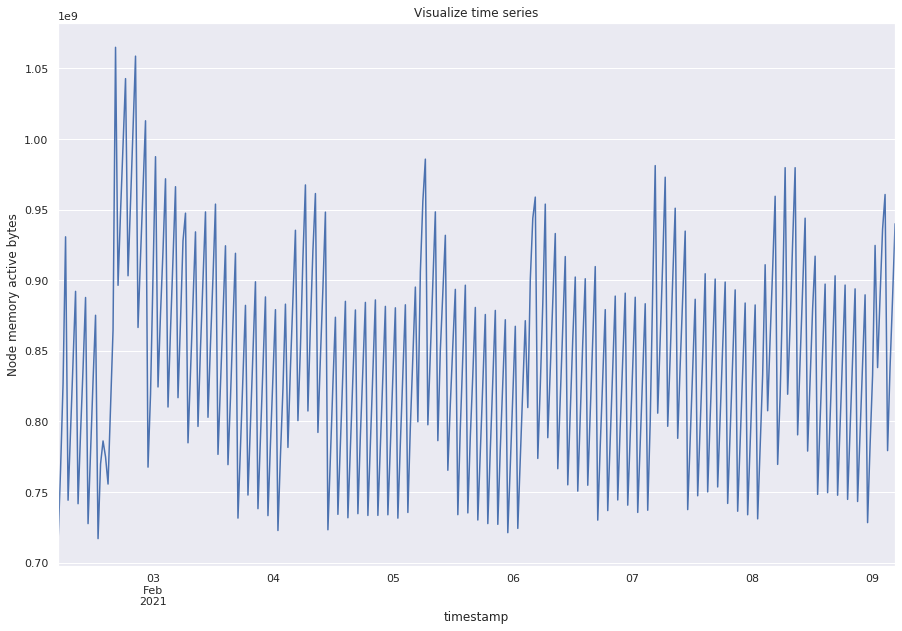
For continuity, we are going to use the same data that we used in the concepts notebook. Scale it down to 30 min samples because training takes a long time otherwise.
metric_df = pd.read_pickle("../data/raw/ts.pkl")
### 30 mins because it gets very difficult to model otherwise
ts = metric_df["value"].astype(float).resample("30min").mean()
sns.set()
ts.plot(figsize=(15, 10))
plt.title("Visualize time series")
plt.ylabel("Node memory active bytes")
plt.show()
# Divide into train and test set
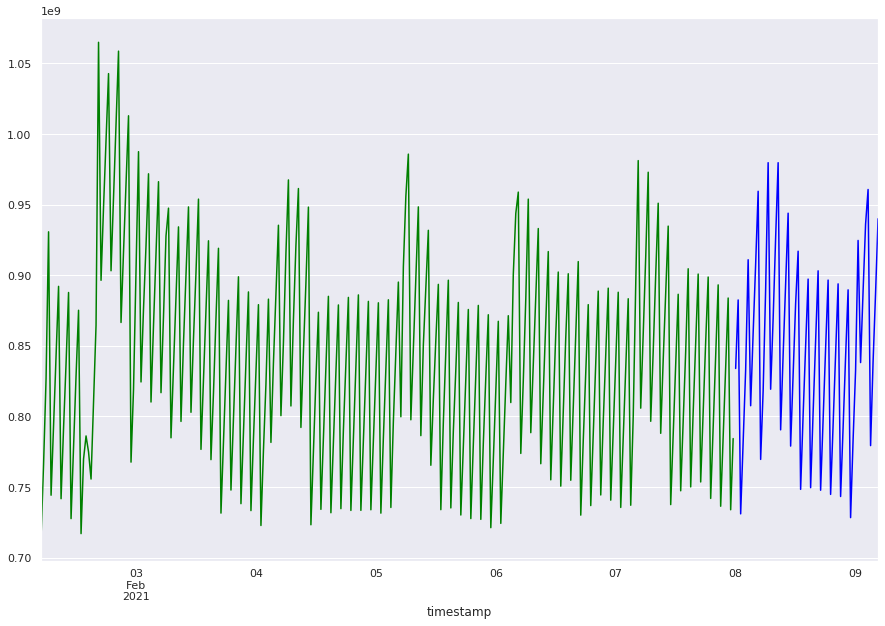
train = ts[:"2021-02-07"]
test = ts["2021-02-08":]

# Define helper dates
first_date = train.index[0]
sample_date = pd.to_datetime("2021-02-06", utc=True)
start_date = pd.to_datetime("2021-02-08", utc=True)
end_date = pd.to_datetime("2021-02-09", utc=True)
# Plot train and test sets
train.plot(figsize=(15, 10), color="green")
test.plot(figsize=(15, 10), color="blue")
<matplotlib.axes._subplots.AxesSubplot at 0x7fd47ff856d8>
def plot_predicts_aam(pred_train, pred):
    """
    Plots train, test, prediction of training set, and prediction of test set
    for auto arima and fbprophet
    """
    train.plot(figsize=(15, 10), color="green", label="Train actual")

    pd.Series(pred_train, index=train[:start_date].index).plot(
        figsize=(15, 10), color="red", label="Train prediction"
    )

    test.plot(figsize=(15, 10), color="blue", label="Test actual")

    pd.Series(pred, index=test[start_date:].index).plot(
        figsize=(15, 10), color="orange", label="Test prediction"
    )
    plt.legend()
    plt.show()


def plot_predicts_man(pred_train, pred):
    """
    Plots train, test, prediction of training set, and prediction of test set
    for manual ARIMA
    """
    train.plot(figsize=(15, 10), color="green", label="Train actual")

    pred_train.plot(figsize=(15, 10), color="red", label="Train prediction")

    test.plot(figsize=(15, 10), color="blue", label="Test actual")

    pred.plot(figsize=(15, 10), color="orange", label="Test prediction")
    plt.legend()
    plt.show()
Auto Arima
aam_default = auto_arima(train)
pred_aam_default = aam_default.predict(n_periods=len(test))
pred_train_aam_default = aam_default.predict(n_periods=len(train[:start_date]))
aam_default.summary()
| Dep. Variable: | y | No. Observations: | 278 |
|---|---|---|---|
| Model: | SARIMAX(0, 0, 1) | Log Likelihood | -5418.948 |
| Date: | Tue, 06 Apr 2021 | AIC | 10843.896 |
| Time: | 22:27:24 | BIC | 10854.779 |
| Sample: | 0 | HQIC | 10848.263 |
| - 278 | |||
| Covariance Type: | opg |
| coef | std err | z | P>|z| | [0.025 | 0.975] | |
|---|---|---|---|---|---|---|
| intercept | 8.4e+08 | 6.11e-10 | 1.38e+18 | 0.000 | 8.4e+08 | 8.4e+08 |
| ma.L1 | 0.2307 | 0.067 | 3.427 | 0.001 | 0.099 | 0.363 |
| sigma2 | 5.066e+15 | 1.05e-19 | 4.82e+34 | 0.000 | 5.07e+15 | 5.07e+15 |
| Ljung-Box (L1) (Q): | 0.00 | Jarque-Bera (JB): | 1.97 |
|---|---|---|---|
| Prob(Q): | 0.95 | Prob(JB): | 0.37 |
| Heteroskedasticity (H): | 0.68 | Skew: | -0.05 |
| Prob(H) (two-sided): | 0.06 | Kurtosis: | 2.60 |
Warnings:
[1] Covariance matrix calculated using the outer product of gradients (complex-step).
[2] Covariance matrix is singular or near-singular, with condition number 3.47e+51. Standard errors may be unstable.
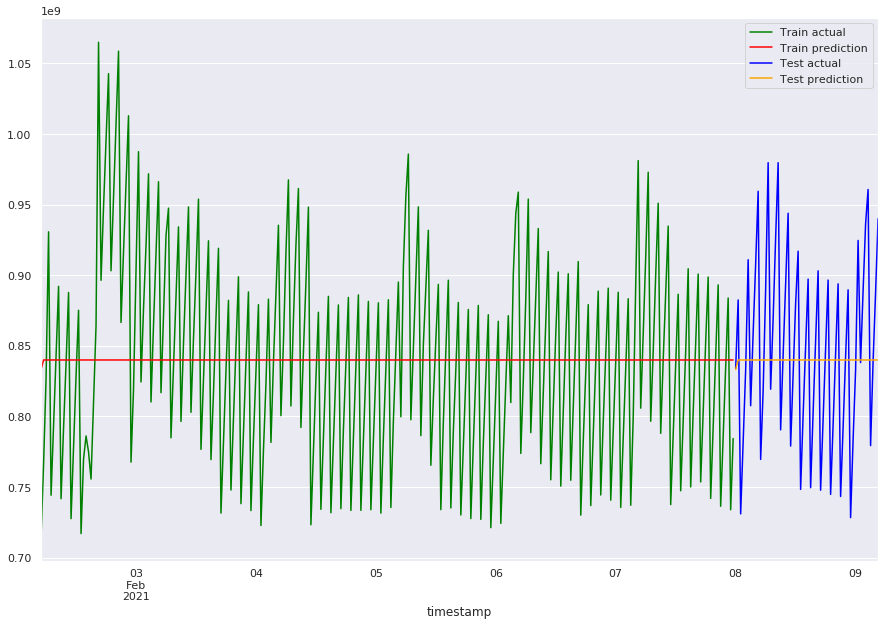
plot_predicts_aam(pred_train_aam_default, pred_aam_default)
mae_train_aam_default = mean_absolute_error(pred_train_aam_default, train)
mae_aam_default = mean_absolute_error(pred_aam_default, test)
print(f"train error: {mae_train_aam_default}, test error: {mae_aam_default}")
train error: 59704447.00298849, test error: 55499026.40818263
Auto arima with seasonality and trend
aam_tuned = auto_arima(
    train,
    #            exogenous=,
    m=4,  # SARIMAX s
    max_order=None,
    max_p=5,  # Search till p=6
    max_q=5,  # Search till q=6
    max_d=2,  # Search till d=2
    max_P=4,  # Search till P=2
    max_Q=4,  # Search till Q=2
    max_D=2,  # Search till D=2
    maxiter=30,  # Increase if you see no convergence
    njobs=7,  # Number of parallel processes
    trend="ct",  ##ctt for quadratic; accounts for trend in data
    information_criterion="aic",  # out of bag aic, aicc, bic, hqic
    # out_of_sample_size=int(len(ts) * 0.2),  ## Validation set of 20% for oob
)
aam_tuned.summary()
| Dep. Variable: | y | No. Observations: | 278 |
|---|---|---|---|
| Model: | SARIMAX(3, 0, 2)x(0, 0, [1, 2, 3], 4) | Log Likelihood | -5295.031 |
| Date: | Tue, 06 Apr 2021 | AIC | 10612.062 |
| Time: | 22:28:27 | BIC | 10651.966 |
| Sample: | 0 | HQIC | 10628.071 |
| - 278 | |||
| Covariance Type: | opg |
| coef | std err | z | P>|z| | [0.025 | 0.975] | |
|---|---|---|---|---|---|---|
| intercept | 7.802e+08 | 378.075 | 2.06e+06 | 0.000 | 7.8e+08 | 7.8e+08 |
| drift | -1.389e+05 | 5.9e+05 | -0.235 | 0.814 | -1.3e+06 | 1.02e+06 |
| ar.L1 | 0.5139 | 0.142 | 3.628 | 0.000 | 0.236 | 0.792 |
| ar.L2 | -0.9205 | 0.177 | -5.200 | 0.000 | -1.267 | -0.574 |
| ar.L3 | 0.5036 | 0.124 | 4.051 | 0.000 | 0.260 | 0.747 |
| ma.L1 | 0.1562 | 0.222 | 0.702 | 0.482 | -0.280 | 0.592 |
| ma.L2 | 0.9495 | 0.262 | 3.628 | 0.000 | 0.437 | 1.462 |
| ma.S.L4 | 0.6971 | 0.268 | 2.605 | 0.009 | 0.173 | 1.221 |
| ma.S.L8 | 0.6389 | 0.342 | 1.871 | 0.061 | -0.030 | 1.308 |
| ma.S.L12 | 0.3947 | 0.252 | 1.565 | 0.118 | -0.100 | 0.889 |
| sigma2 | 4.393e+15 | 1.78e-06 | 2.46e+21 | 0.000 | 4.39e+15 | 4.39e+15 |
| Ljung-Box (L1) (Q): | 3.20 | Jarque-Bera (JB): | 1005.96 |
|---|---|---|---|
| Prob(Q): | 0.07 | Prob(JB): | 0.00 |
| Heteroskedasticity (H): | 0.44 | Skew: | 1.36 |
| Prob(H) (two-sided): | 0.00 | Kurtosis: | 11.91 |
Warnings:
[1] Covariance matrix calculated using the outer product of gradients (complex-step).
[2] Covariance matrix is singular or near-singular, with condition number 5.15e+44. Standard errors may be unstable.
pred_aam_tuned = aam_tuned.predict(n_periods=len(test))
pred_train_aam_tuned = aam_tuned.predict(n_periods=len(train[:start_date]))
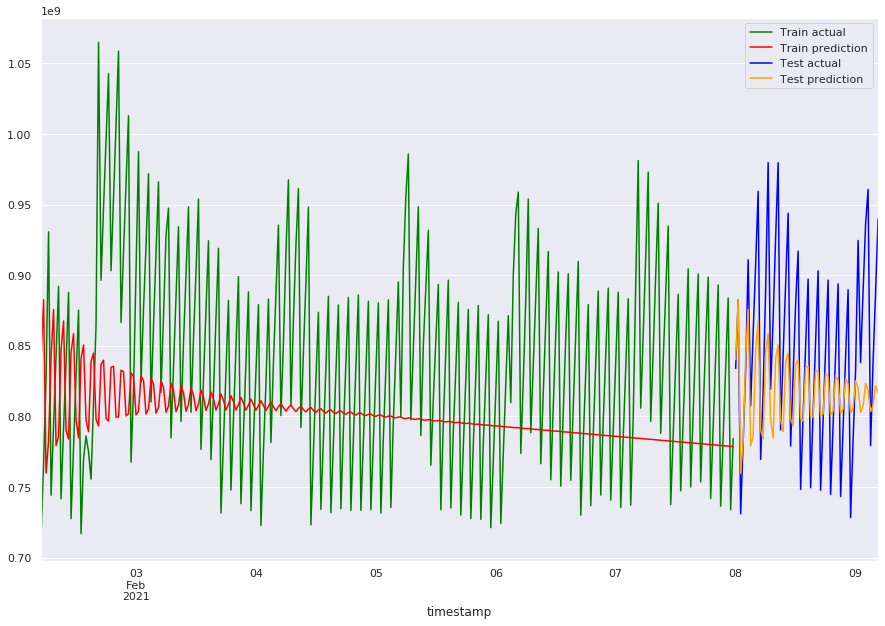
plot_predicts_aam(pred_train_aam_tuned, pred_aam_tuned)
mae_train_aam_tuned = mean_absolute_error(pred_train_aam_tuned, train)
mae_aam_tuned = mean_absolute_error(pred_aam_tuned, test)
print(f"train error: {mae_train_aam_tuned}, test error: {mae_aam_tuned}")
train error: 69104681.4315166, test error: 48501662.87943022
ARIMA manual
first_date = train.index[1]
end_date = test.index[-1]
arima_312 = ARIMA(train, order=(3, 1, 2)).fit()
pred_arima_312 = arima_312.predict(start=start_date, end=end_date)
pred_train_arima_312 = arima_312.predict(start=first_date, end=start_date)
arima_312.summary()
| Dep. Variable: | D.value | No. Observations: | 277 |
|---|---|---|---|
| Model: | ARIMA(3, 1, 2) | Log Likelihood | -5126.479 |
| Method: | css-mle | S.D. of innovations | 25828119.266 |
| Date: | Tue, 06 Apr 2021 | AIC | 10266.958 |
| Time: | 22:28:28 | BIC | 10292.326 |
| Sample: | 02-02-2021 | HQIC | 10277.137 |
| - 02-07-2021 |
| coef | std err | z | P>|z| | [0.025 | 0.975] | |
|---|---|---|---|---|---|---|
| const | 2.504e+05 | nan | nan | nan | nan | nan |
| ar.L1.D.value | -1.0033 | nan | nan | nan | nan | nan |
| ar.L2.D.value | -0.9420 | 0.000 | -6697.477 | 0.000 | -0.942 | -0.942 |
| ar.L3.D.value | -0.9387 | 0.000 | -7245.019 | 0.000 | -0.939 | -0.938 |
| ma.L1.D.value | 1.0522 | 0.047 | 22.469 | 0.000 | 0.960 | 1.144 |
| ma.L2.D.value | 0.0563 | 0.047 | 1.201 | 0.230 | -0.036 | 0.148 |
| Real | Imaginary | Modulus | Frequency | |
|---|---|---|---|---|
| AR.1 | -1.0000 | -0.0000j | 1.0000 | -0.5000 |
| AR.2 | -0.0017 | -1.0321j | 1.0321 | -0.2503 |
| AR.3 | -0.0017 | +1.0321j | 1.0321 | 0.2503 |
| MA.1 | -1.0044 | +0.0000j | 1.0044 | 0.5000 |
| MA.2 | -17.6740 | +0.0000j | 17.6740 | 0.5000 |
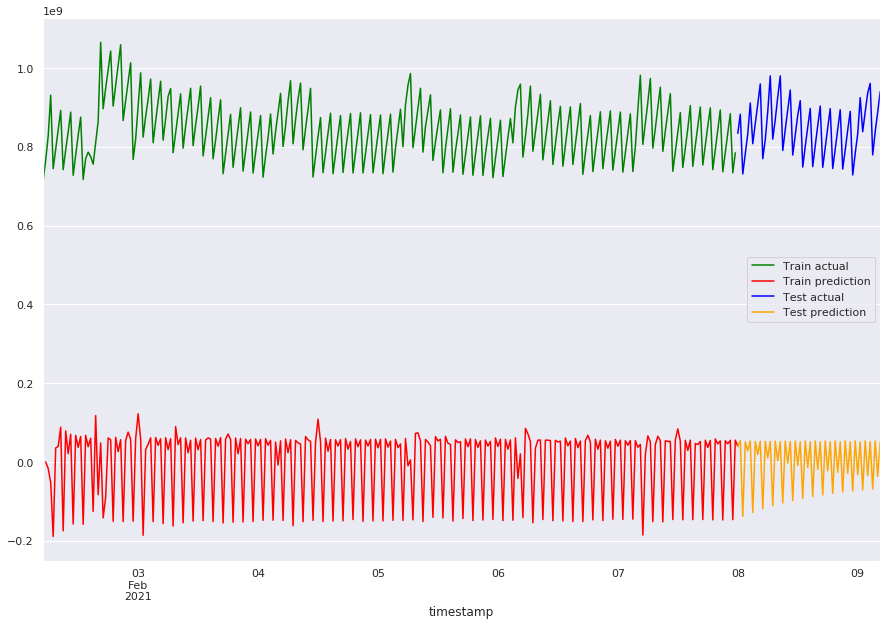
plot_predicts_man(pred_train_arima_312, pred_arima_312)
mae_train_arima_312 = mean_absolute_error(pred_train_arima_312, train)
mae_arima_312 = mean_absolute_error(pred_arima_312, test)
print(f"train error: {mae_train_arima_312}, test error: {mae_arima_312}")
train error: 839811151.3563331, test error: 847309633.8738719
arima_313 = ARIMA(train, order=(3, 1, 3)).fit()
pred_arima_313 = arima_313.predict(start=start_date, end=end_date)
pred_train_arima_313 = arima_313.predict(start=first_date, end=start_date)
arima_313.summary()
| Dep. Variable: | D.value | No. Observations: | 277 |
|---|---|---|---|
| Model: | ARIMA(3, 1, 3) | Log Likelihood | -5056.131 |
| Method: | css-mle | S.D. of innovations | 19786859.521 |
| Date: | Tue, 06 Apr 2021 | AIC | 10128.263 |
| Time: | 22:28:34 | BIC | 10157.255 |
| Sample: | 02-02-2021 | HQIC | 10139.895 |
| - 02-07-2021 |
| coef | std err | z | P>|z| | [0.025 | 0.975] | |
|---|---|---|---|---|---|---|
| const | 2.504e+05 | 1.182 | 2.12e+05 | 0.000 | 2.5e+05 | 2.5e+05 |
| ar.L1.D.value | -1.0004 | 0.000 | -2137.761 | 0.000 | -1.001 | -1.000 |
| ar.L2.D.value | -1.0004 | 0.000 | -2138.443 | 0.000 | -1.001 | -1.000 |
| ar.L3.D.value | -1.0000 | nan | nan | nan | nan | nan |
| ma.L1.D.value | 0.9829 | 0.008 | 123.454 | 0.000 | 0.967 | 0.999 |
| ma.L2.D.value | 0.9780 | nan | nan | nan | nan | nan |
| ma.L3.D.value | 0.9840 | nan | nan | nan | nan | nan |
| Real | Imaginary | Modulus | Frequency | |
|---|---|---|---|---|
| AR.1 | -1.0000 | -0.0000j | 1.0000 | -0.5000 |
| AR.2 | -0.0002 | -1.0000j | 1.0000 | -0.2500 |
| AR.3 | -0.0002 | +1.0000j | 1.0000 | 0.2500 |
| MA.1 | -1.0056 | -0.0000j | 1.0056 | -0.5000 |
| MA.2 | 0.0058 | -1.0053j | 1.0053 | -0.2491 |
| MA.3 | 0.0058 | +1.0053j | 1.0053 | 0.2491 |
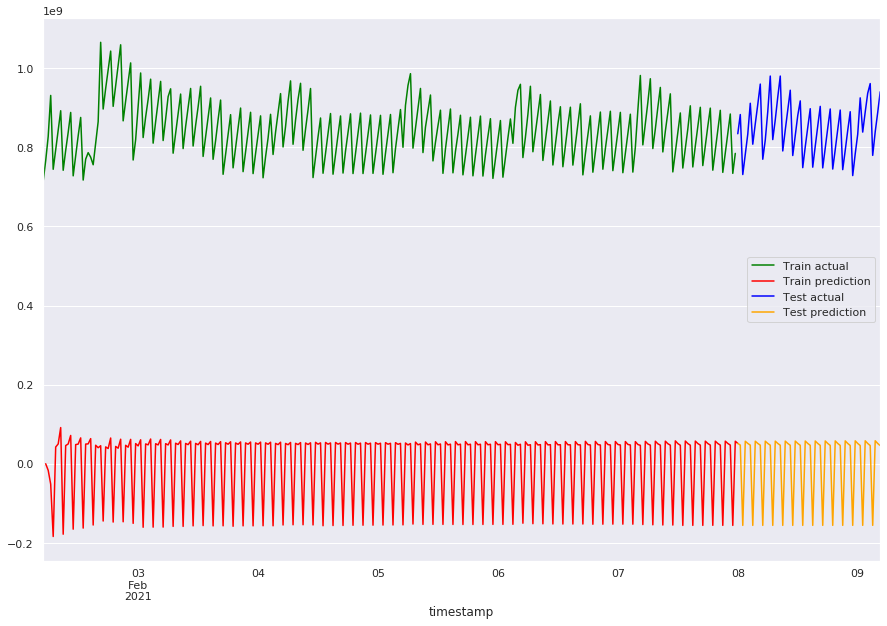
plot_predicts_man(pred_train_arima_313, pred_arima_313)
mae_train_arima_313 = mean_absolute_error(pred_train_arima_313, train)
mae_arima_313 = mean_absolute_error(pred_arima_313, test)
print(f"train error: {mae_train_arima_313}, test error: {mae_arima_313}")
train error: 839955467.486684, test error: 846572065.3563603
### SARIMAX
sarima_3133134 = SARIMAX(
    train, order=(3, 1, 3), seasonal_order=(3, 1, 3, 4)
).fit()
pred_sarima_3133134 = sarima_3133134.predict(start=start_date, end=end_date)
pred_train_sarima_3133134 = sarima_3133134.predict(
    start=first_date, end=start_date
)
sarima_3133134.summary()
| Dep. Variable: | value | No. Observations: | 278 |
|---|---|---|---|
| Model: | SARIMAX(3, 1, 3)x(3, 1, 3, 4) | Log Likelihood | -5041.015 |
| Date: | Tue, 06 Apr 2021 | AIC | 10108.029 |
| Time: | 22:28:40 | BIC | 10154.952 |
| Sample: | 02-02-2021 | HQIC | 10126.865 |
| - 02-07-2021 | |||
| Covariance Type: | opg |
| coef | std err | z | P>|z| | [0.025 | 0.975] | |
|---|---|---|---|---|---|---|
| ar.L1 | 0.1141 | 10.763 | 0.011 | 0.992 | -20.981 | 21.209 |
| ar.L2 | -0.0459 | 11.028 | -0.004 | 0.997 | -21.661 | 21.569 |
| ar.L3 | -0.0476 | 8.423 | -0.006 | 0.995 | -16.557 | 16.462 |
| ma.L1 | -0.1001 | 10.746 | -0.009 | 0.993 | -21.161 | 20.961 |
| ma.L2 | 0.0281 | 11.041 | 0.003 | 0.998 | -21.613 | 21.669 |
| ma.L3 | 0.0612 | 8.464 | 0.007 | 0.994 | -16.527 | 16.650 |
| ar.S.L4 | -0.8363 | 0.188 | -4.452 | 0.000 | -1.205 | -0.468 |
| ar.S.L8 | 0.2501 | 0.286 | 0.875 | 0.381 | -0.310 | 0.810 |
| ar.S.L12 | 0.5071 | 0.170 | 2.978 | 0.003 | 0.173 | 0.841 |
| ma.S.L4 | 0.5739 | 0.178 | 3.226 | 0.001 | 0.225 | 0.923 |
| ma.S.L8 | -0.5780 | 0.174 | -3.318 | 0.001 | -0.919 | -0.237 |
| ma.S.L12 | -0.5949 | 0.165 | -3.605 | 0.000 | -0.918 | -0.271 |
| sigma2 | 8.479e+14 | 1.93e-12 | 4.39e+26 | 0.000 | 8.48e+14 | 8.48e+14 |
| Ljung-Box (L1) (Q): | 4.34 | Jarque-Bera (JB): | 3002.25 |
|---|---|---|---|
| Prob(Q): | 0.04 | Prob(JB): | 0.00 |
| Heteroskedasticity (H): | 0.36 | Skew: | 0.93 |
| Prob(H) (two-sided): | 0.00 | Kurtosis: | 19.14 |
Warnings:
[1] Covariance matrix calculated using the outer product of gradients (complex-step).
[2] Covariance matrix is singular or near-singular, with condition number 1.73e+42. Standard errors may be unstable.
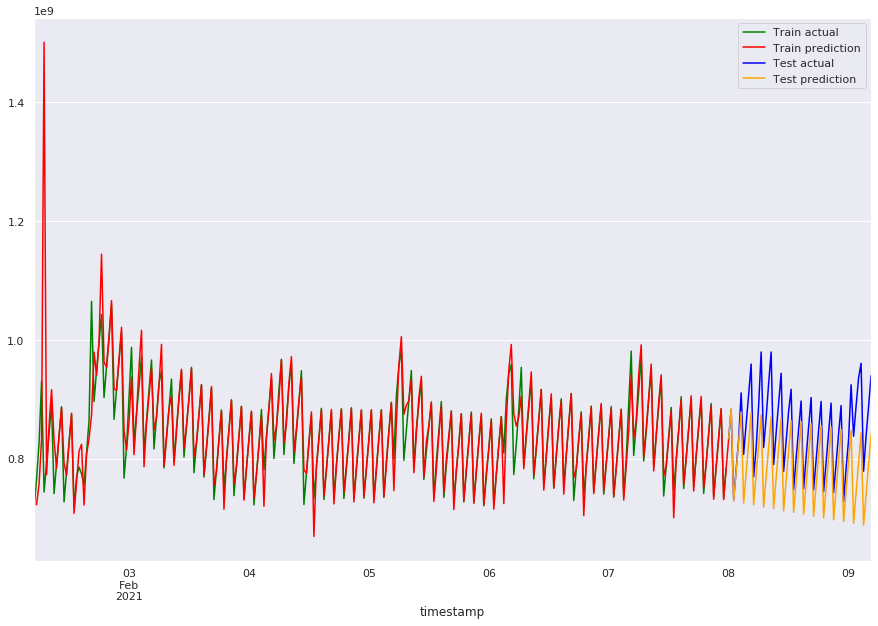
plot_predicts_man(pred_train_sarima_3133134, pred_sarima_3133134)
mae_train_sarima_3133134 = mean_absolute_error(
    pred_train_sarima_3133134, train
)
mae_sarima_3133134 = mean_absolute_error(pred_sarima_3133134, test)
print(
    f"train error: {mae_train_sarima_3133134}, test error: {mae_sarima_3133134}"
)
train error: 76039810.8512889, test error: 61440631.127542816
Fb Prophet
Fb prophet is an open source forecasting tool developed by facebook. It’s working is explained in this paper.
## Convert data to prophet type
train_fb = (
    train.tz_localize(None)
    .reset_index()
    .rename(columns={"timestamp": "ds", "value": "y"})
)
test_fb = (
    test.tz_localize(None)
    .reset_index()
    .rename(columns={"timestamp": "ds", "value": "y"})
)
train_fb
| ds | y | |
|---|---|---|
| 0 | 2021-02-02 05:00:00 | 7.149560e+08 |
| 1 | 2021-02-02 05:30:00 | 7.661634e+08 |
| 2 | 2021-02-02 06:00:00 | 8.268711e+08 |
| 3 | 2021-02-02 06:30:00 | 9.307392e+08 |
| 4 | 2021-02-02 07:00:00 | 7.441884e+08 |
| ... | ... | ... |
| 273 | 2021-02-07 21:30:00 | 7.860433e+08 |
| 274 | 2021-02-07 22:00:00 | 8.343954e+08 |
| 275 | 2021-02-07 22:30:00 | 8.838431e+08 |
| 276 | 2021-02-07 23:00:00 | 7.338868e+08 |
| 277 | 2021-02-07 23:30:00 | 7.843077e+08 |
278 rows × 2 columns
proph_model = Prophet()
pm = proph_model.fit(train_fb)
INFO:fbprophet:Disabling yearly seasonality. Run prophet with yearly_seasonality=True to override this.
INFO:fbprophet:Disabling weekly seasonality. Run prophet with weekly_seasonality=True to override this.
future = pd.concat([train_fb[["ds"]], test_fb[["ds"]]])
forecast = proph_model.predict(future)
forecast[["ds", "yhat", "yhat_lower", "yhat_upper"]].tail()
| ds | yhat | yhat_lower | yhat_upper | |
|---|---|---|---|---|
| 331 | 2021-02-09 02:30:00 | 8.159005e+08 | 7.226906e+08 | 8.959902e+08 |
| 332 | 2021-02-09 03:00:00 | 8.249485e+08 | 7.356618e+08 | 9.102047e+08 |
| 333 | 2021-02-09 03:30:00 | 8.335671e+08 | 7.366603e+08 | 9.268038e+08 |
| 334 | 2021-02-09 04:00:00 | 8.408378e+08 | 7.512273e+08 | 9.263069e+08 |
| 335 | 2021-02-09 04:30:00 | 8.461327e+08 | 7.632898e+08 | 9.335285e+08 |
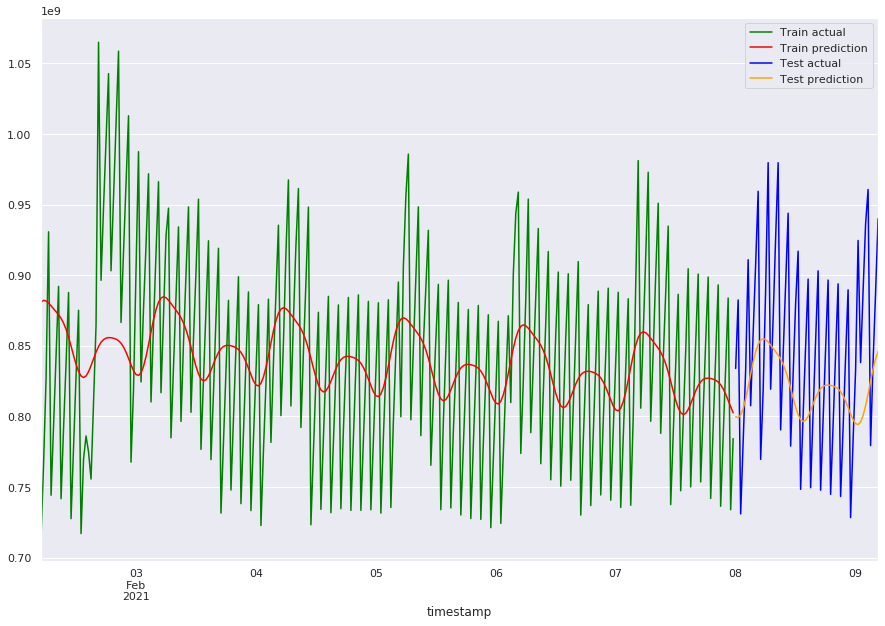
plot_predicts_aam(forecast["yhat"][:278].values, forecast["yhat"][278:].values)
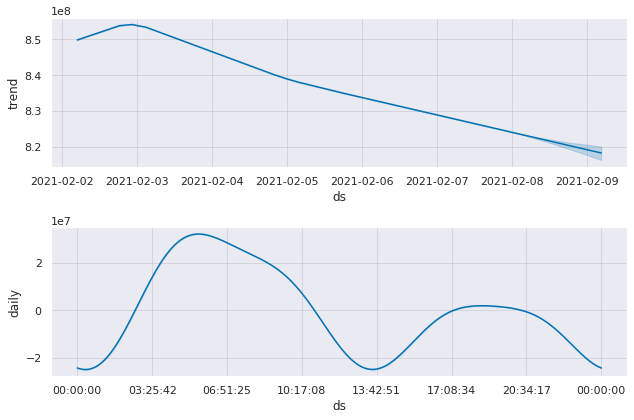
## Prophet finds components as well and forecasts the trend
fig2 = proph_model.plot_components(forecast)
mae_train_prophet = mean_absolute_error(forecast.yhat.iloc[:278], train)
mae_prophet = mean_absolute_error(forecast.yhat.iloc[278:], test)
print(f"train error: {mae_train_prophet}, test error: {mae_prophet}")
train error: 57397365.15948534, test error: 59003779.90772527
Decomposition + trend prediction
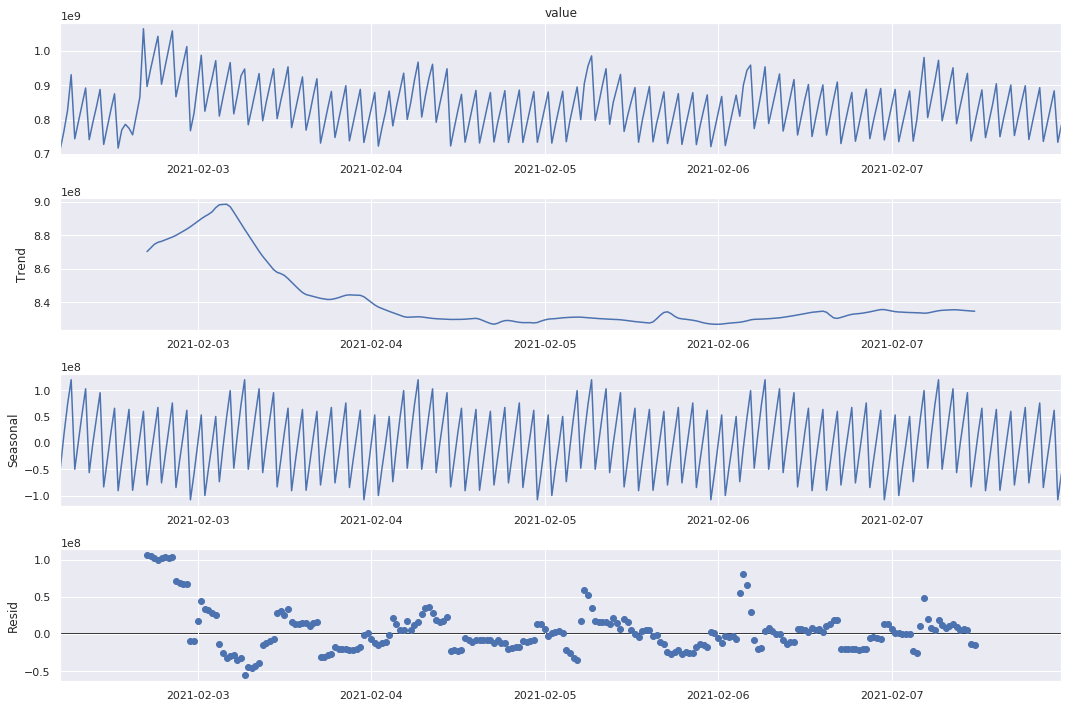
In this method we use the concept of seasonality decomposition. We remove the seasonal component and forecast the adjusted time series. Once we have the forecasted value, we add the seasonality back to the prediction. This method, like SARIMAX, assumes that we have some prior knowledge of the seasons in our time series.
We use prophet for trend prediction, but any method can be used.
sns.set()
plt.rc("figure", figsize=(15, 10))
sd_add = seasonal_decompose(train, model="additive", freq=2 * 24)
sd_add.plot()
plt.show()
train_adj = train - sd_add.seasonal
train_adj_fb = (
    train_adj.tz_localize(None)
    .reset_index()
    .rename(columns={"timestamp": "ds", 0: "y"})
)
test_fb = (
    test.tz_localize(None)
    .reset_index()
    .rename(columns={"timestamp": "ds", 0: "y"})
)
# Here we take one period from the train decomposed set
# with similar start and end point as the test set
test_set_period_adj = sd_add.seasonal["2021-02-03":"2021-02-04 4:30"]
## Prophet model
proph_model = Prophet()
pm = proph_model.fit(train_adj_fb)
future = pd.concat([train_adj_fb[["ds"]], test_fb[["ds"]]])
forecast = proph_model.predict(future)
INFO:fbprophet:Disabling yearly seasonality. Run prophet with yearly_seasonality=True to override this.
INFO:fbprophet:Disabling weekly seasonality. Run prophet with weekly_seasonality=True to override this.
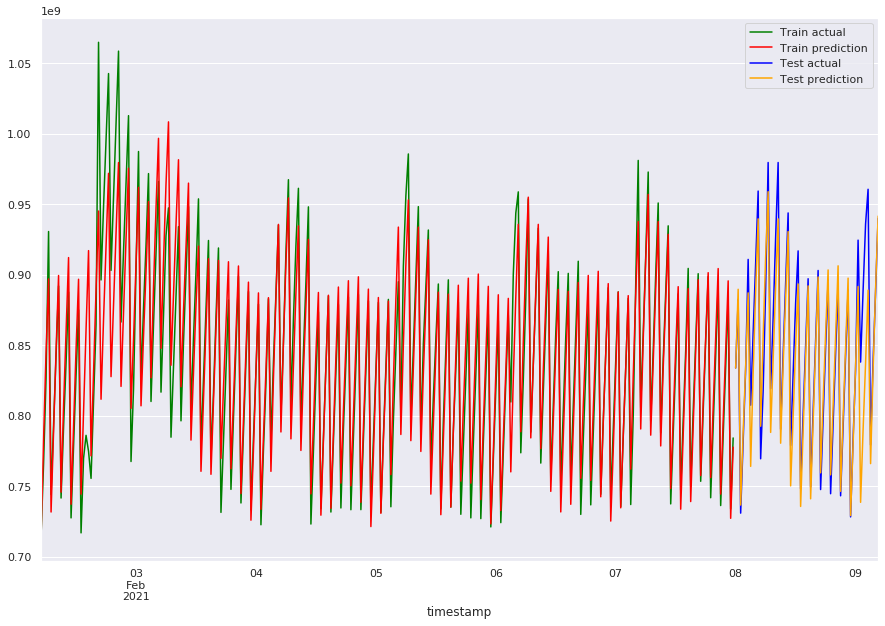
train_predict_fb_adj = forecast["yhat"][:278].values + sd_add.seasonal.values
predict_fb_adj = forecast["yhat"][278:].values + test_set_period_adj.values
plot_predicts_aam(train_predict_fb_adj, predict_fb_adj)
mae_train_fb_adj = mean_absolute_error(train_predict_fb_adj, train)
mae_fb_adj = mean_absolute_error(predict_fb_adj, test)
print(f"train error: {mae_train_fb_adj}, test error: {mae_fb_adj}")
train error: 18666697.80771729, test error: 20050884.18485607
Next, we look at mean absolute errors for all the methods together
pd.DataFrame(
    data=[
        ["aam_default", mae_train_aam_default, mae_aam_default],
        ["aam_tuned", mae_train_aam_tuned, mae_aam_tuned],
        ["arima_312", mae_train_arima_312, mae_arima_312],
        ["ARIMA_313", mae_train_arima_313, mae_arima_313],
        ["sarima_3133134", mae_train_sarima_3133134, mae_sarima_3133134],
        ["prophet", mae_train_prophet, mae_prophet],
        ["decompose+ARIMA", mae_train_fb_adj, mae_fb_adj],
    ],
    columns=["Method", "Train error", "Test error"],
)
| Method | Train error | Test error | |
|---|---|---|---|
| 0 | aam_default | 5.970445e+07 | 5.549903e+07 |
| 1 | aam_tuned | 6.910468e+07 | 4.850166e+07 |
| 2 | arima_312 | 8.398112e+08 | 8.473096e+08 |
| 3 | ARIMA_313 | 8.399555e+08 | 8.465721e+08 |
| 4 | sarima_3133134 | 7.603981e+07 | 6.144063e+07 |
| 5 | prophet | 5.739737e+07 | 5.900378e+07 |
| 6 | decompose+ARIMA | 1.866670e+07 | 2.005088e+07 |
Conclusion
In this notebook, we saw some frequently explored ways to forecast a time series. In our example, the method with seasonal decomposition and trend prediction using fbprophet perfromed the best. The method of removing the seasonal effects and predicting the trend performs well if your data has obvious seasonality. Prophet is a powerful tool that works well with various types of time series and it’s performance can be increased with using methods like decomposition. For a general dataset, similar experiments need to be conducted to choose a model.